
Case study
Beyond Borders 2026
EBANX
Data visualisation and generative identity for the seventh edition of EBANX's annual study of digital payments across Latin America, Africa and Asia
EBANX is a Brazilian payments company that processes cross-border payments for global businesses selling into emerging markets. Beyond Borders is its annual study of digital payments and e-commerce in those markets, published since 2019 and drawing on the company's own transaction data. The 2026 edition was published as a web report covering Latin America, Africa and Asia.
The orbit
I started from the Global Findex figures on digital payment adoption and built a main visual element out of them: one circle per country, sized by the 2024 share of adults making or receiving digital payments, green where it had grown since 2021.
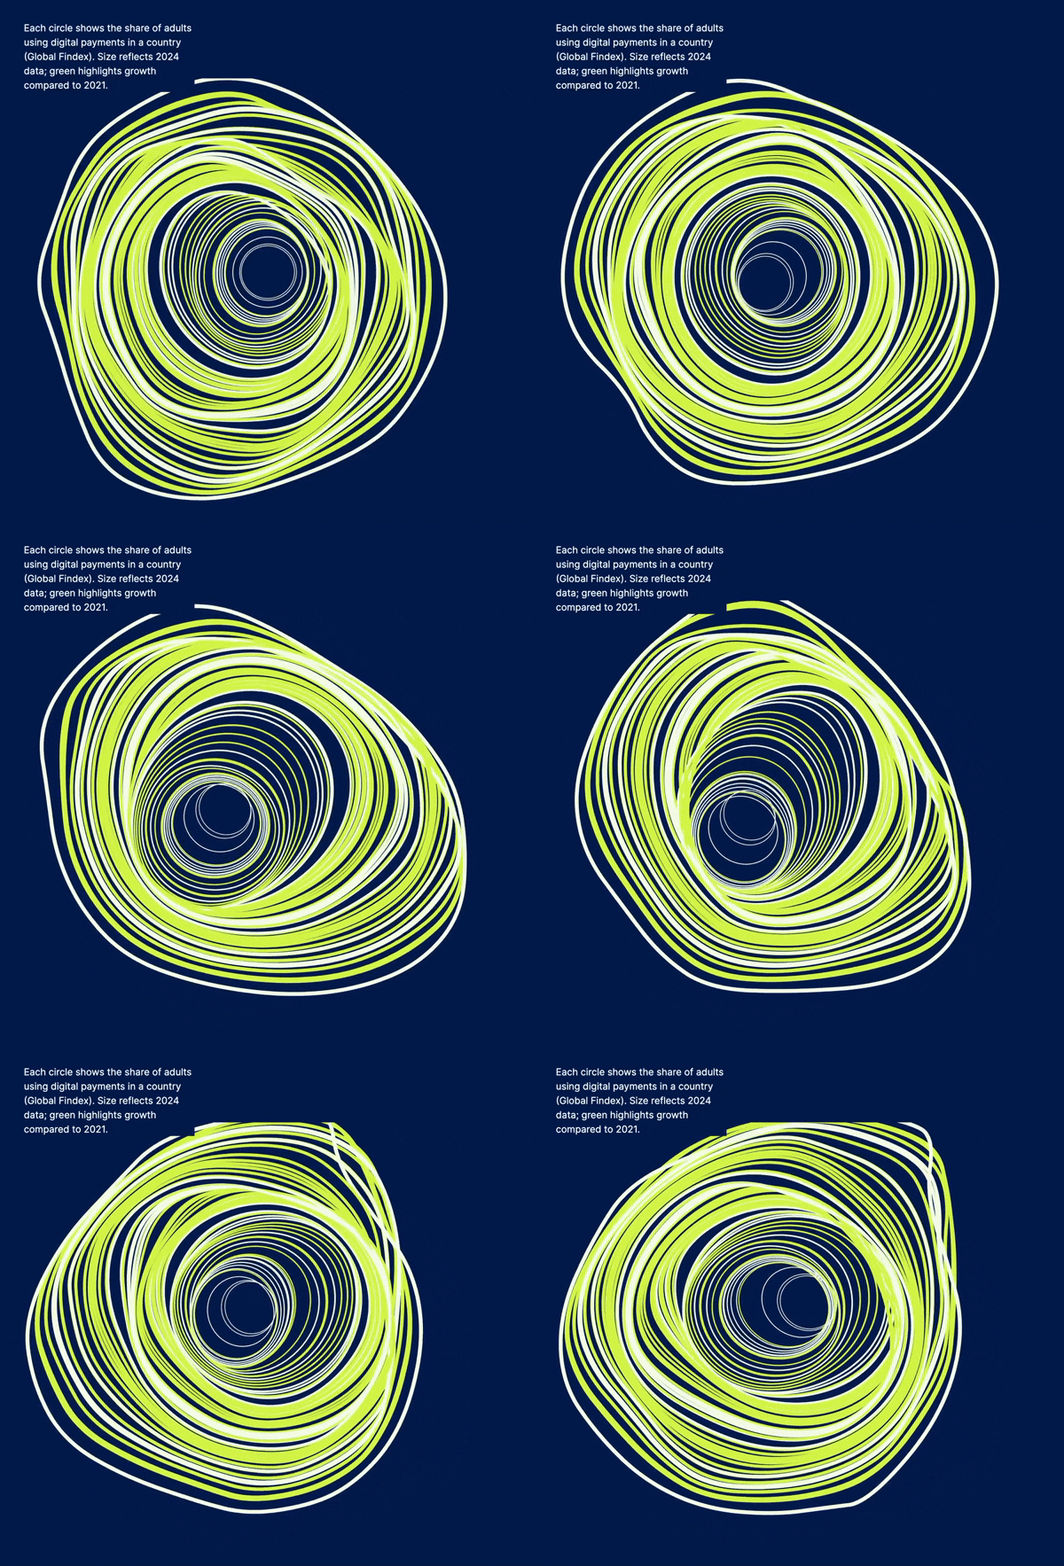
The circles are displaced by a 3D Perlin noise field, written in p5. Perlin noise was developed for film in the early 1980s to generate natural-looking texture — clouds, terrain, smoke — and its defining property is coherence: neighbouring points receive similar values, so the field drifts as a whole rather than flickering point by point. Applied to the country circles it produced motion that reads as breathing.
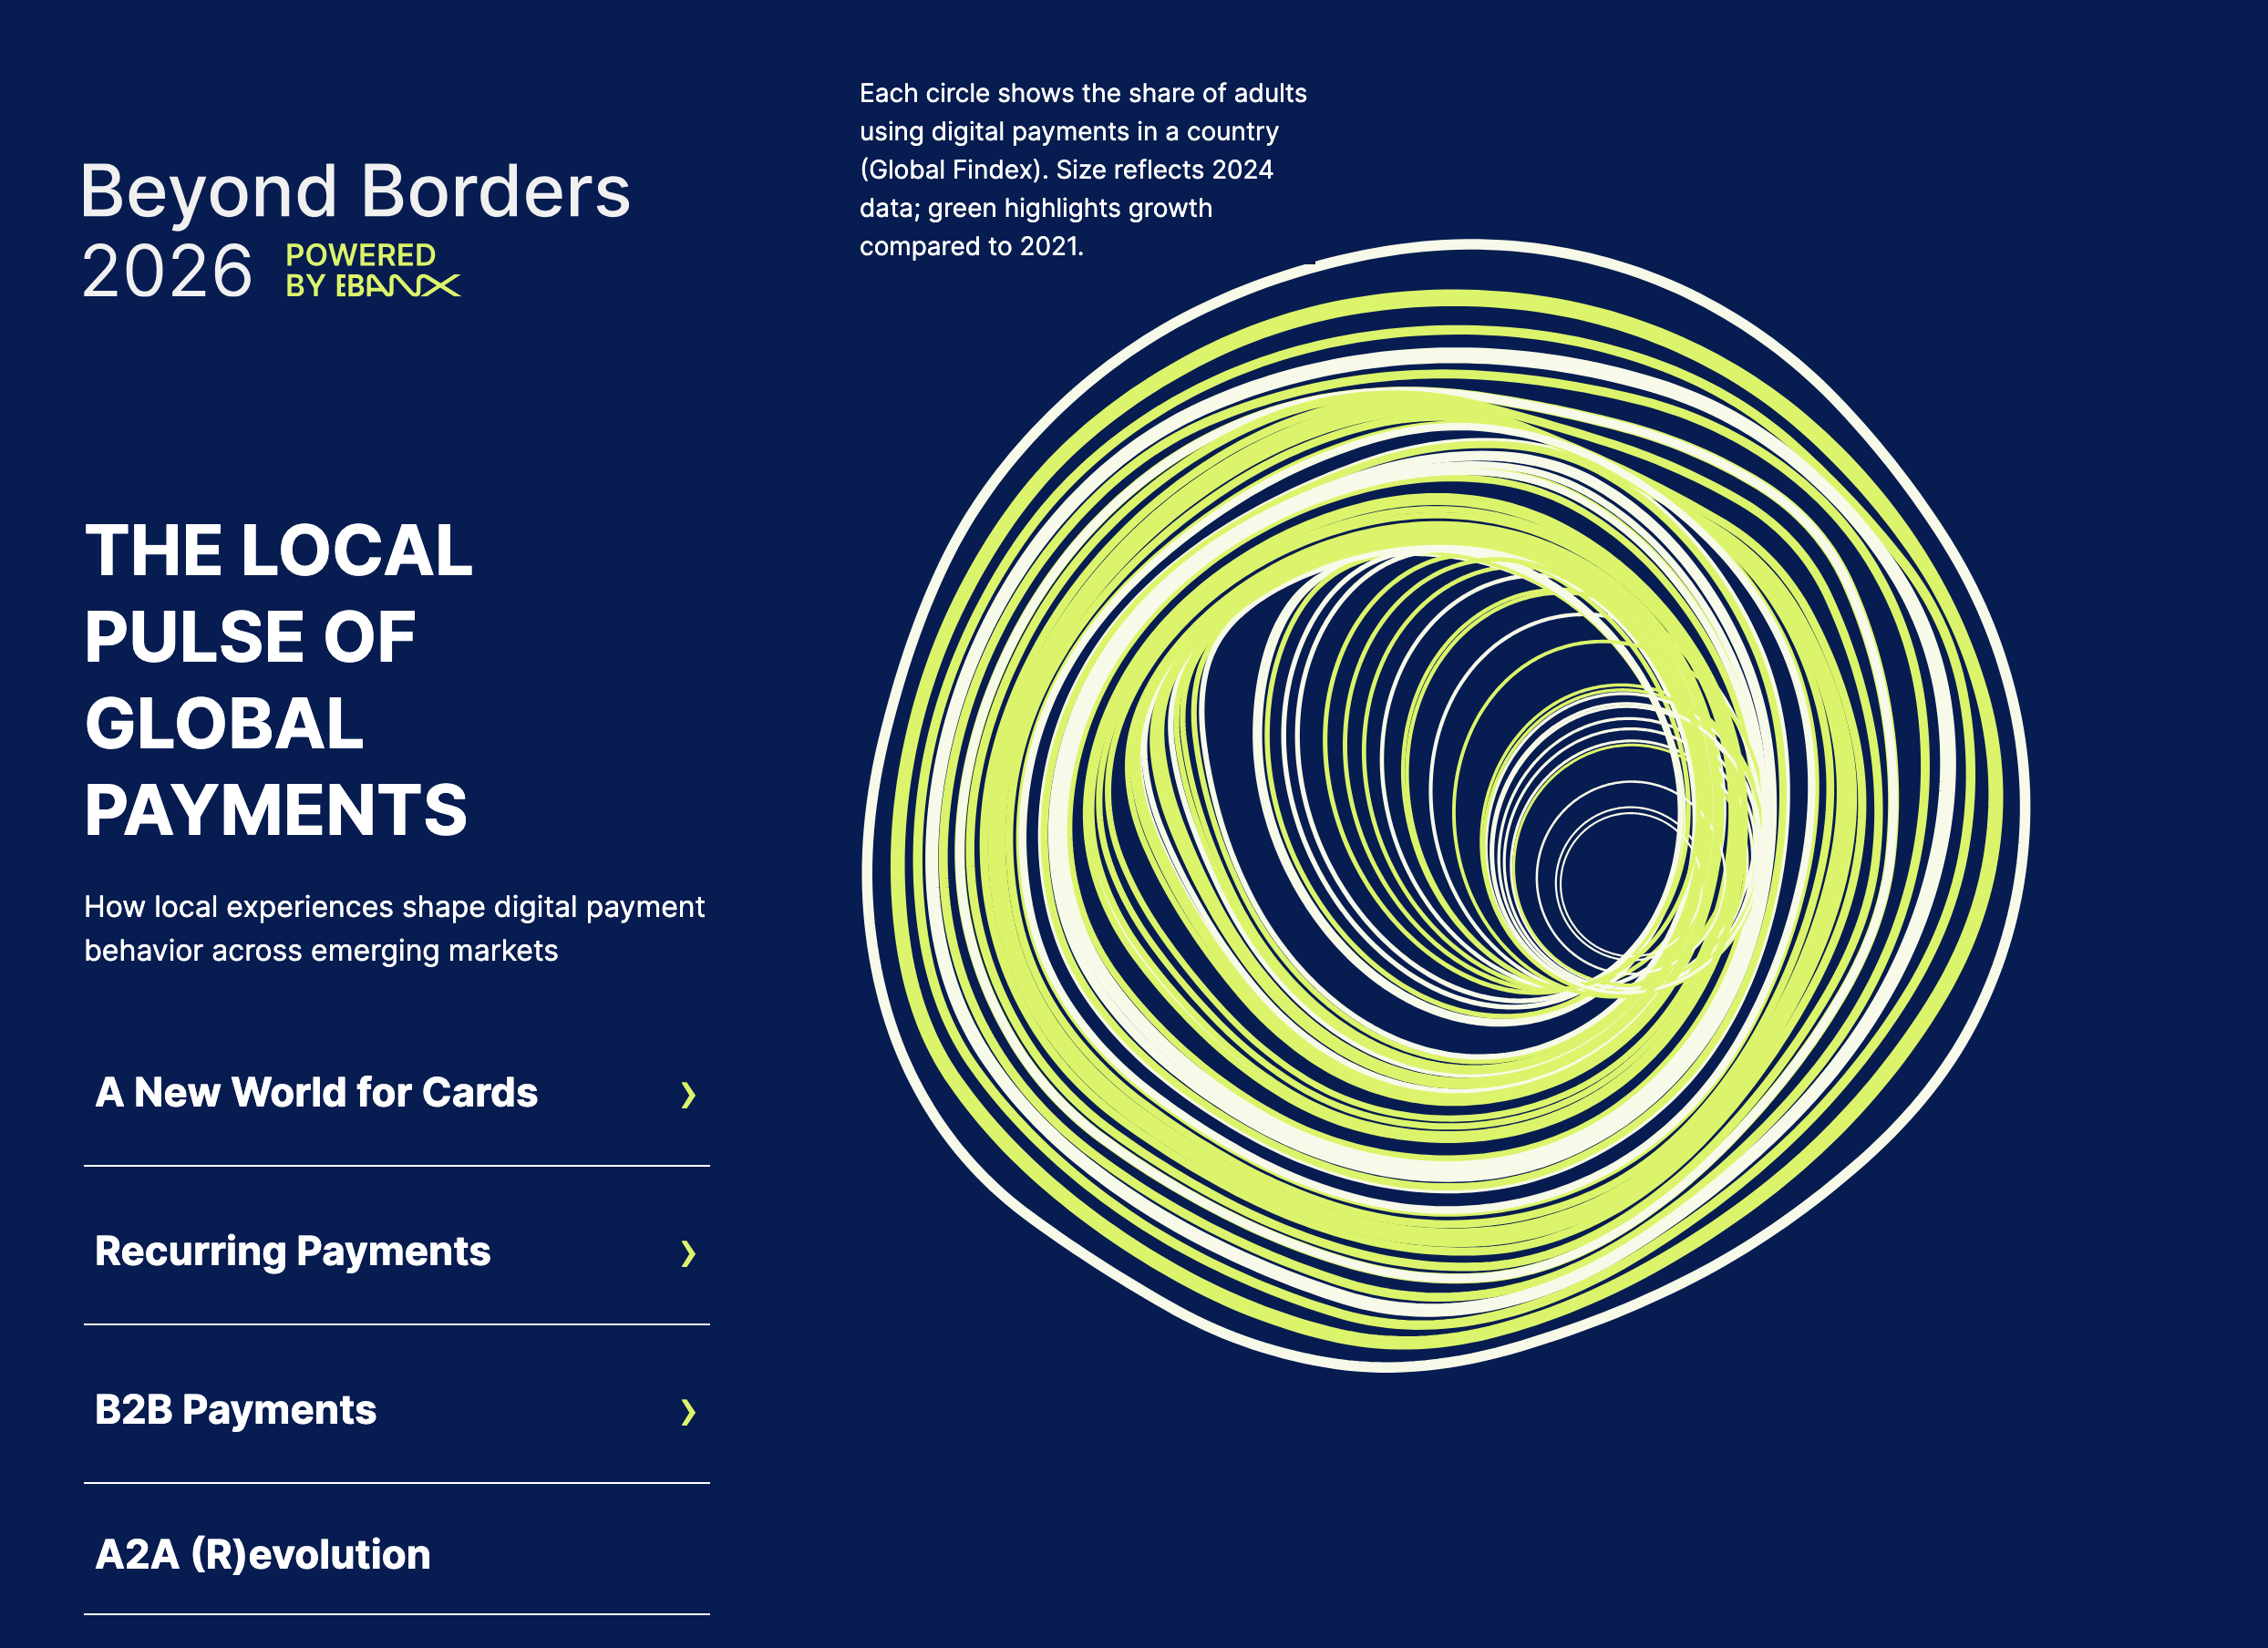
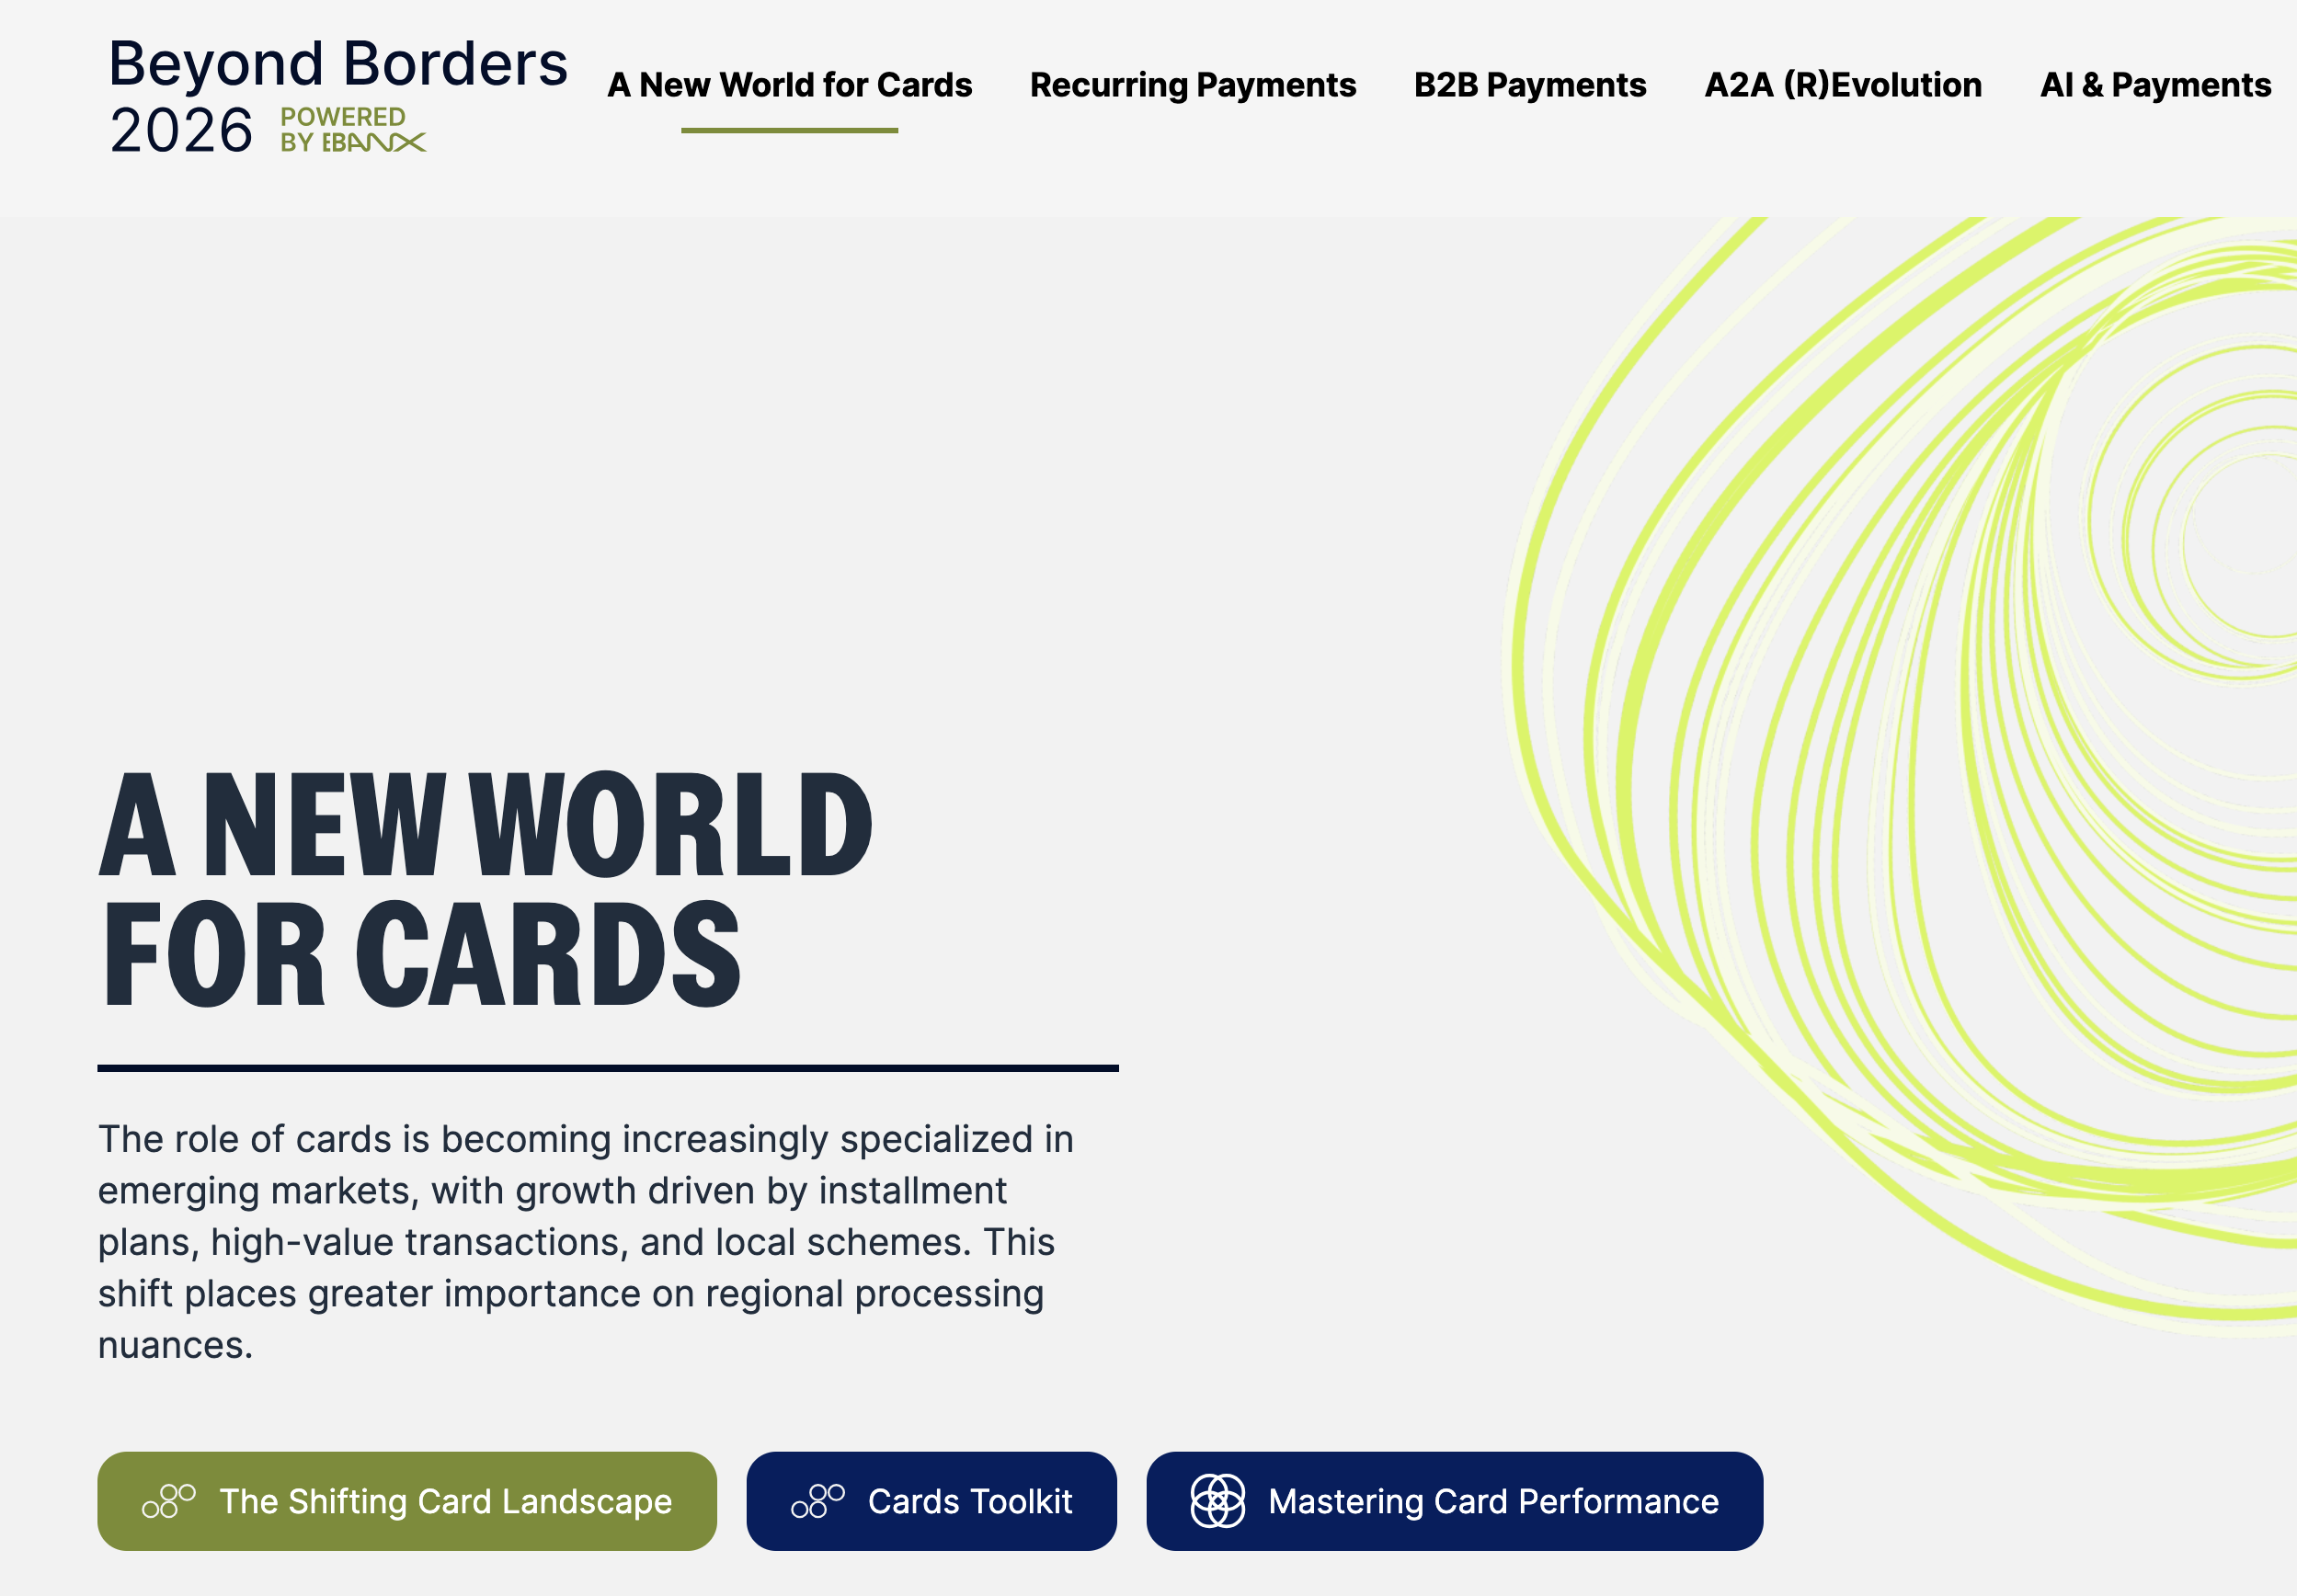
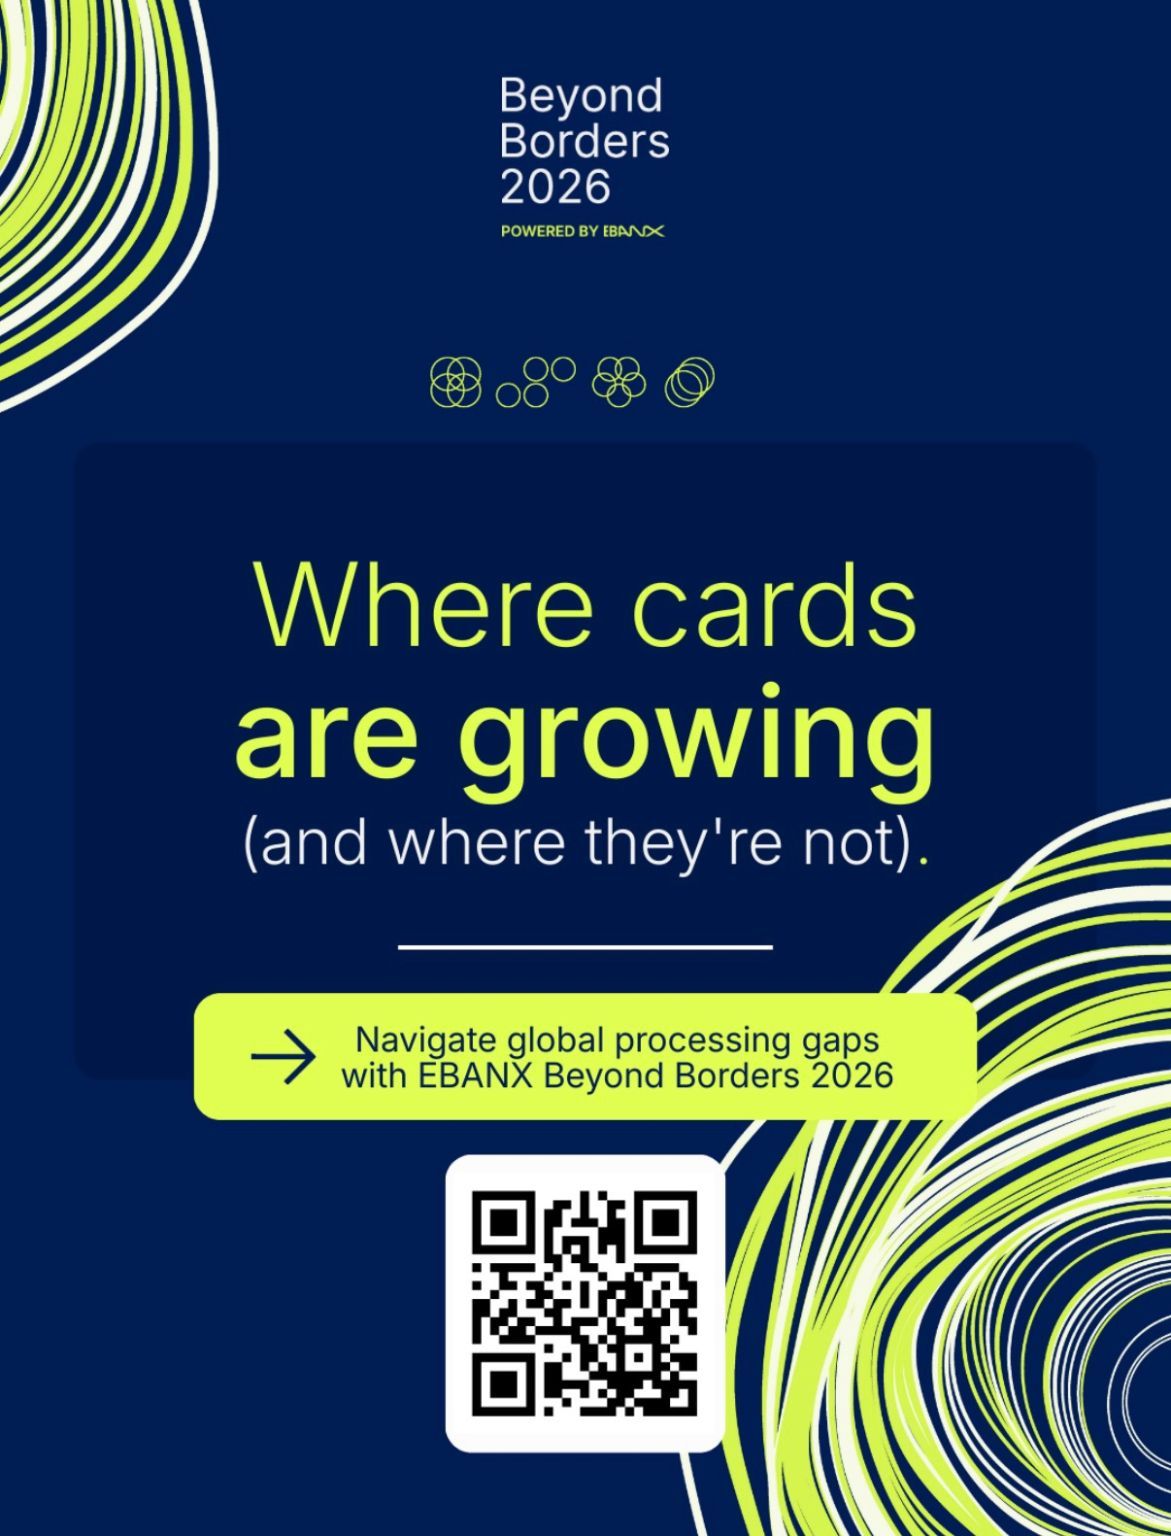
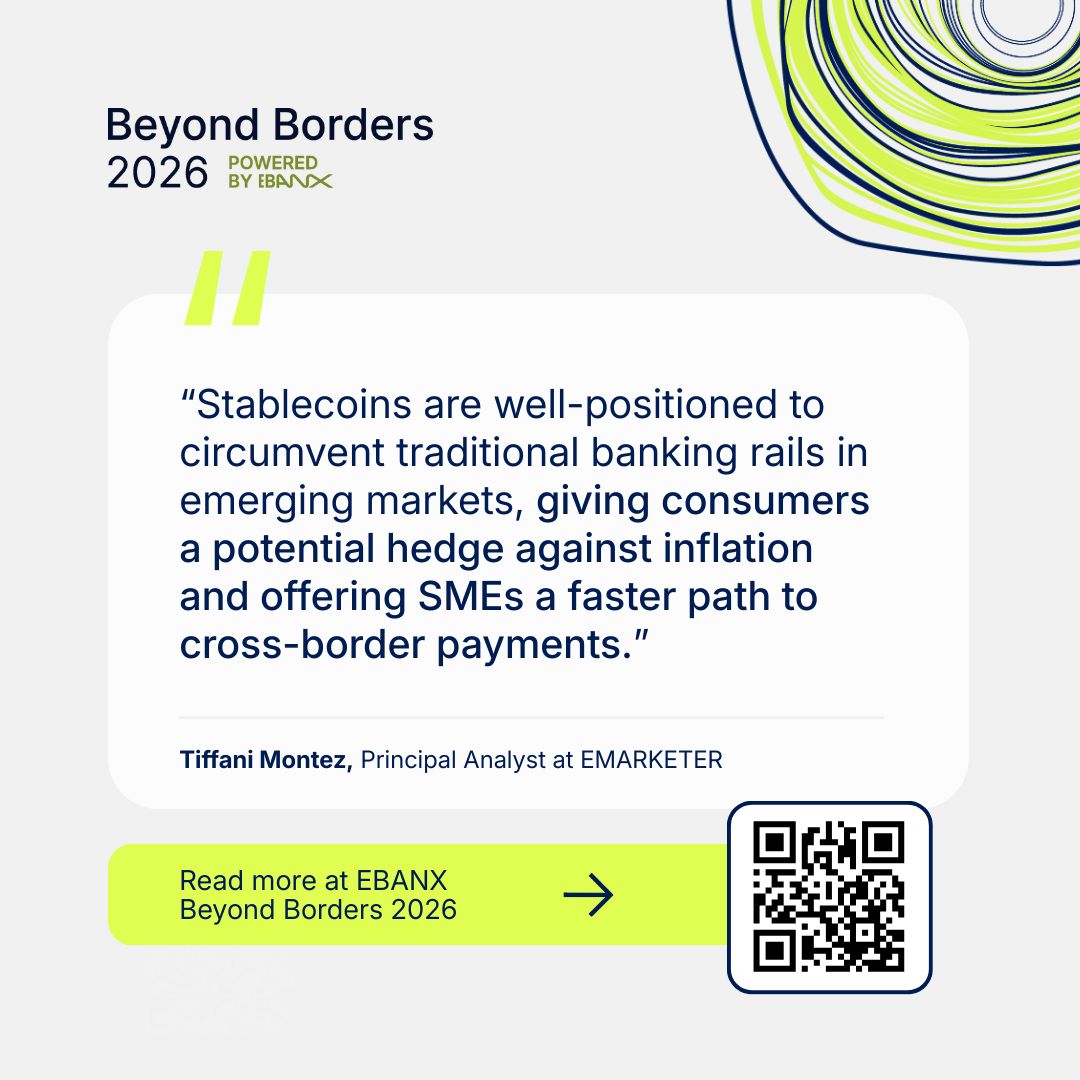
The report was subtitled The Local Pulse of Global Payments. The orbit set the visual language for the rest of the report, designed by EBANX's design team:
The charts
I was also commissioned to design the report's custom charts, the ones that couldn't be built in Flourish, either because of the form or the interaction. EBANX supplied the data, mostly proprietary transaction data, with public sources including the World Bank. I designed them and built them in D3. These are some of the charts, with sample data.